The document
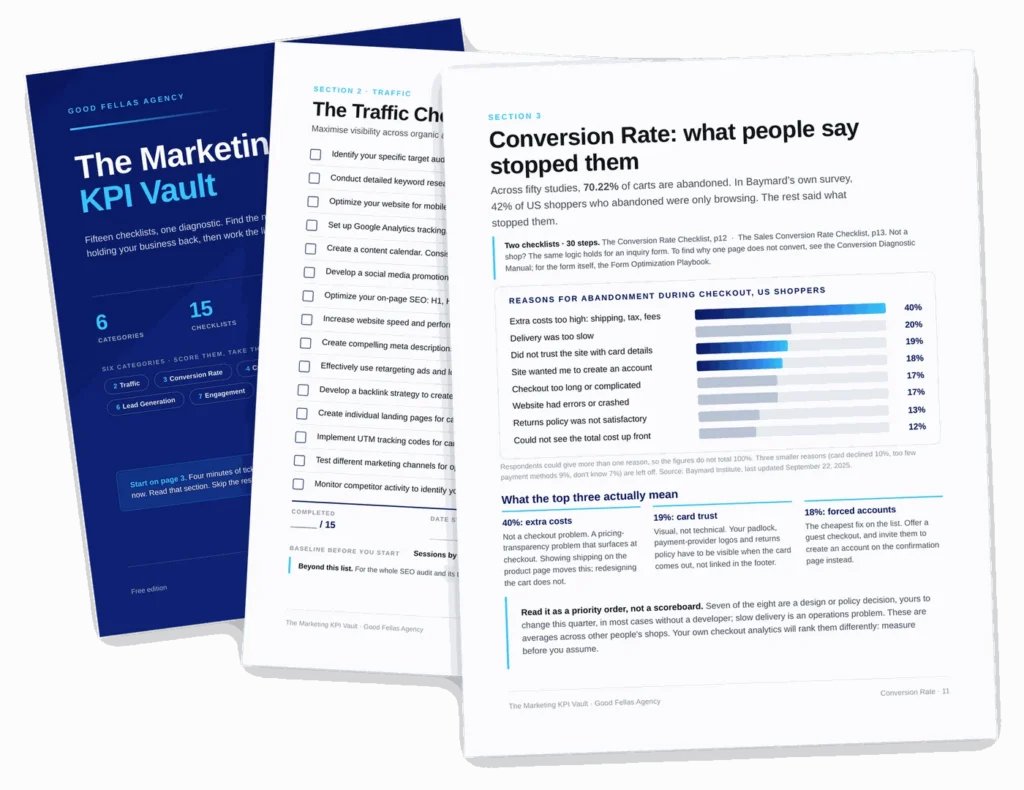
Thirty pages built to be worked through, not read
Every page is one checklist, formatted to print. There is a box to tick, a line for the date, and a score at the foot, because a reference you skim changes nothing and a reference you fill in changes what you do on Monday.
It opens on a four-minute diagnostic rather than a contents page. You answer, you score, and the score tells you which of the six sections is costing you the most right now.
What is inside
Thirty numbers, sorted into the six questions a business actually asks
Most marketing reports hand you everything at once and let you work out which parts matter. This one starts from the question and works back to the metric, so you can open the category you are worried about this month and ignore the other five.
Traffic
The only category upstream of every other one. Sessions, new versus returning, channel mix, and the two numbers that tell you whether a traffic rise is real or a bot.
Conversion rate
Where traffic stops being a vanity number. Site-wide rate, rate by landing page, cart and form abandonment, and what each one should be for a small business site.
Customer retention
The cheapest growth you will ever buy. Repeat rate, churn, lifetime value, and the point at which keeping a customer costs less than finding one.
Return on investment
Three checklists answering one question: is the money coming back? Cost per acquisition, return on ad spend, blended CAC and the payback window.
Lead generation
Capture and nurture, kept apart on purpose. One set of numbers for getting the address, another for what happens to it in the ninety days after.
Engagement
The only category other people have to agree to. Reach, saves, replies and the signals that predict a sale rather than flattering the feed.
How it works
Start with the diagnostic, not the dashboard
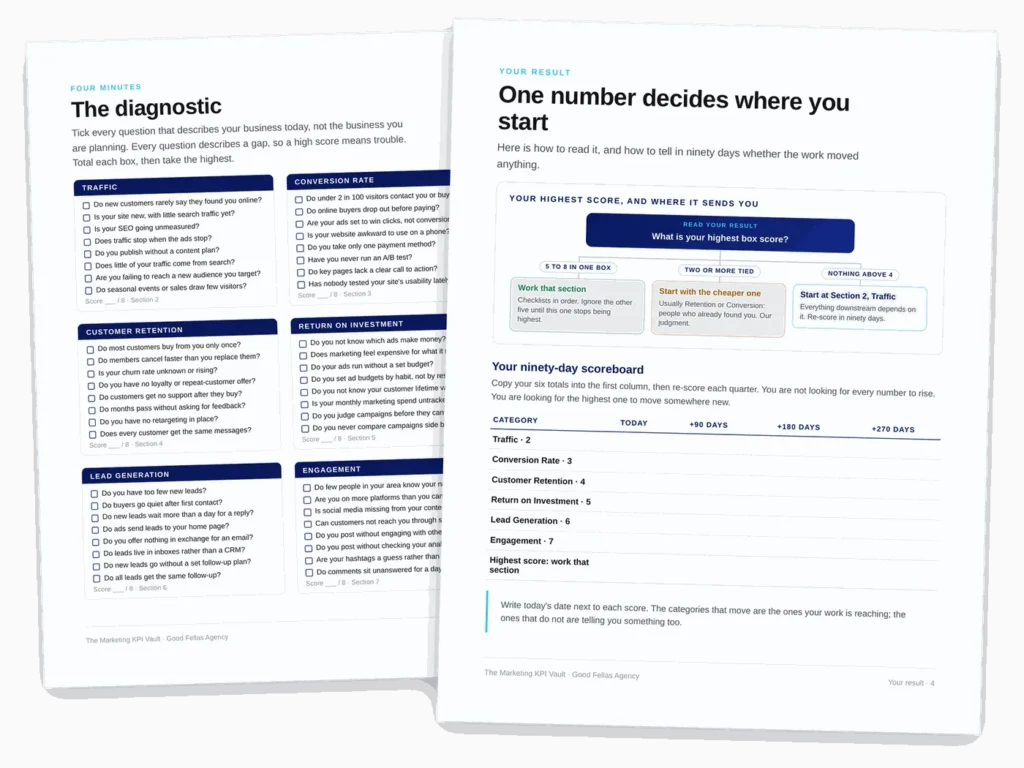
Each category opens with an eight-question diagnostic. You answer yes or no, you score it, and the score tells you which of that category’s metrics are worth your attention right now. A business running no paid ads does not need to look at return on ad spend, and the vault says so rather than leaving you to work it out.
By the numbers
What you are getting
Before you ask
Questions people send us about this one
Do I need Google Analytics set up to use it?
For most of it, yes. Each metric names where the number comes from, and roughly two thirds of them are read from GA4 or Search Console. The retention and return-on-investment categories lean on your own sales records instead, so those work whatever your analytics look like.
Is this for ecommerce or for service businesses?
Both, and the diagnostics are what keep it useful for each. The questions ask whether you sell online, whether you run ads, whether repeat purchase matters to you, and the scoring routes you to the metrics that answer your situation rather than a generic set.
Where do the benchmarks come from?
Published industry sources where one exists, with the source named next to the figure, and our own client work where it does not. Anywhere a benchmark varies widely by sector we give the range rather than a single number, because a single number would be more confident than the data deserves.
How long does it take to work through?
The six diagnostics take about ten minutes end to end. Acting on what they surface is the longer job, which is why each metric ends with one change to make rather than a list of options.