
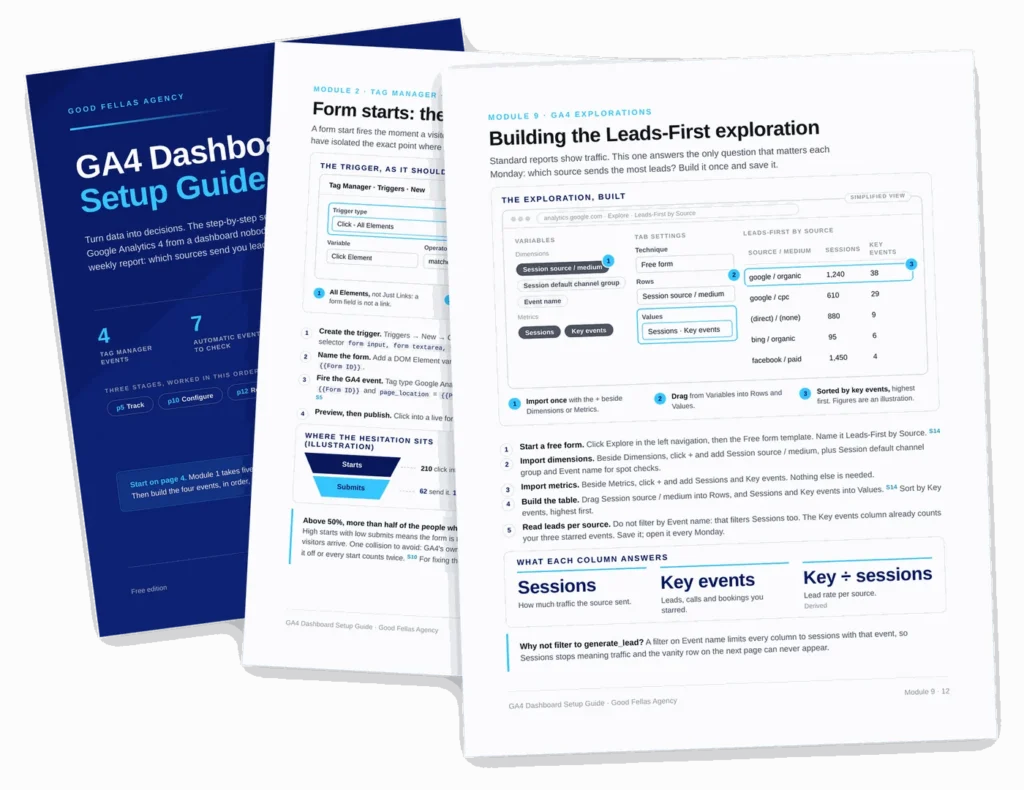
The document
Twelve pages that turn GA4 into something you actually open
Eleven modules covering the four events that matter for a service business, how to fire them in Tag Manager, which to mark as conversions, and the one exploration worth bookmarking.
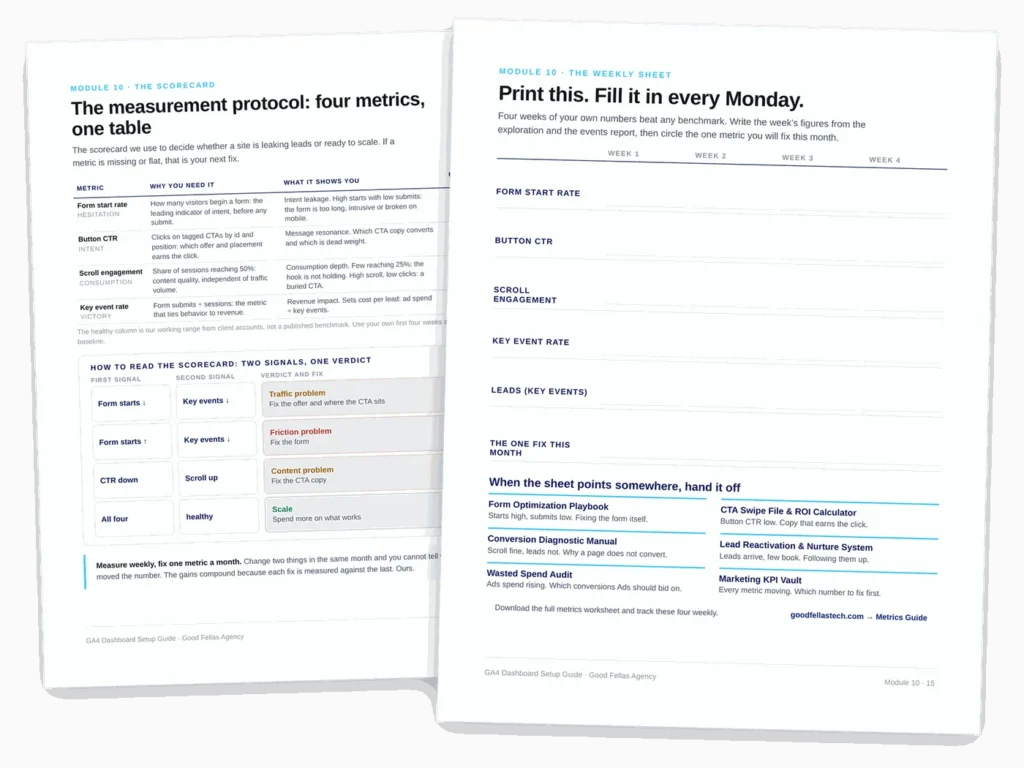
It ends in a measurement protocol: four metrics, one scorecard, each tied to a specific leak, with healthy ranges so a number means something when you look at it.
What is inside
Eleven modules, built around four events
GA4 can report on almost anything, which is why most installations report on nothing useful. The guide narrows it to four events and one report.
The death of the pageview
Why GA4 counts actions rather than arrivals, and how engagement rate replaces bounce rate as the number to watch.
Form starts
The hesitation metric. A Tag Manager visibility trigger that fires when the form is seen, isolating where intent is lost.
Button clicks
The intent metric. Tagging every call to action so you learn which message works and on which page.
Scroll depth
The consumption metric at 25, 50, 75 and 90 percent, which maps exactly where readers stop.
Form submits
The victory metric. Firing on the thank-you page or a data layer push rather than the raw click, so it never double counts.
The leads-first exploration
Source and medium in rows, key events in values. One report that ranks traffic by leads rather than by volume.
A few of the fixes
Six things the guide is specific about
Each is somewhere a standard GA4 setup goes quietly wrong.
The numbers behind it
What the research says
Before you ask
Questions people send us about this one
Do I need Tag Manager, or is enhanced measurement enough?
Both. Enhanced measurement gives you a behavioural baseline for free the moment the stream is live, but it cannot isolate a form start or attribute a specific button. Tag Manager adds the precision layer the four events depend on.
Which four events matter for a service business?
Form start for hesitation, button click for intent, scroll depth for consumption, and the lead event on submit for the result. Together they tell you whether you have a traffic problem, a friction problem or a content problem.
What is a healthy conversion rate in GA4?
The protocol in the guide targets a key event rate of two to five percent, a form start rate of eight to fifteen, button click-through of two to six, and scroll engagement of 40 to 60. All four are in one scorecard.
Why did GA4 replace bounce rate?
Because it counts actions rather than arrivals. Engagement rate is effectively the inverse: an old 70 percent bounce rate reads as roughly 30 percent engagement. A session counts as engaged after ten seconds, a key event, or a second page.


