The document
What one point of conversion is worth, and the buttons that get it
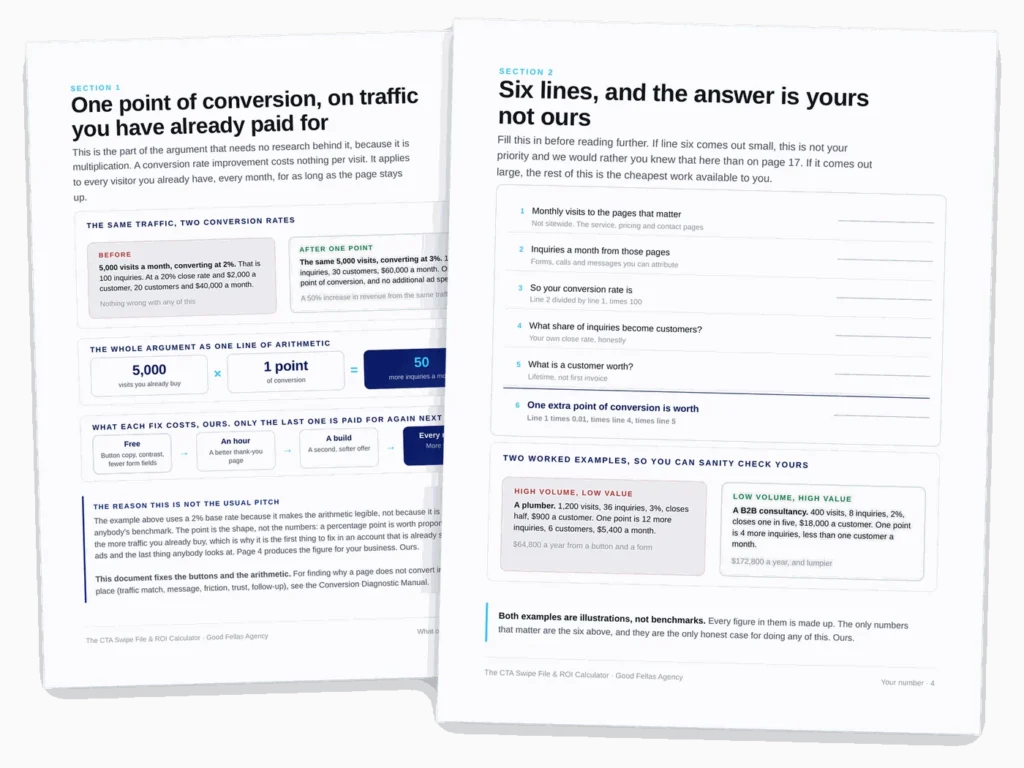
A conversion improvement costs nothing per visit. It applies to every visitor you already have, including the ones you paid for, every month, for as long as the page stays up. The document opens with six lines of arithmetic that turn that into a number for your business rather than anyone’s benchmark.
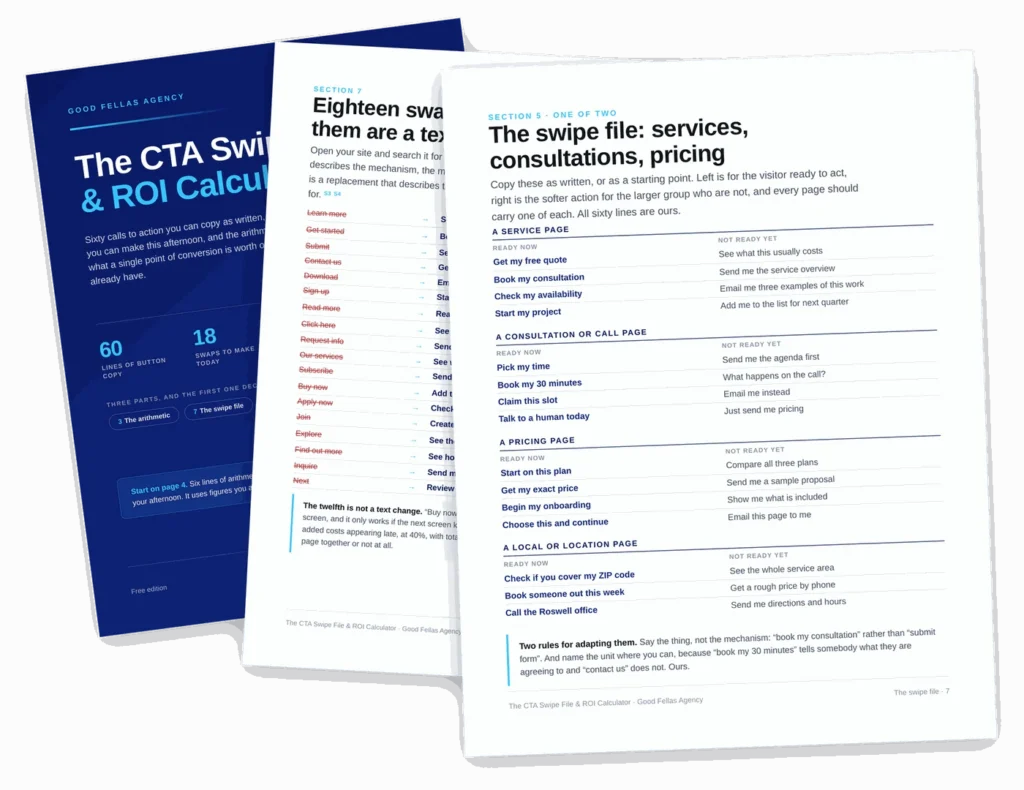
Then sixty calls to action you can copy as written, eighteen swaps you can make this afternoon, and the four levers that decide whether the action on your page is findable, legible, reachable and survivable.
What is inside
Fifteen sections, and the swipe file is the one you will use first
The arithmetic at the front is what makes the case for using it. Everything cited comes from Baymard Institute’s quantitative research, Nielsen Norman Group’s usability studies or the WCAG contrast criteria, quoted verbatim. Every line of button copy is ours.
The six-line calculator
Visits, enquiries, your conversion rate, your close rate, what a customer is worth. Line six is what one extra point pays you a month. If it comes out small, we would rather you knew on page 4.
Sixty lines of button copy
For service pages, consultations, pricing, resources, articles, contact, local pages and case studies. One column for the visitor ready to act, one for the larger group who are not.
Eighteen swaps
Search your own site for the words on the left. Learn more, Get started, Submit, Contact us, Click here. Each with a replacement that describes the destination instead of the mechanism.
Why people actually leave
Baymard asked. The largest answer was “just browsing, not ready to buy” at 42%, and two of the controllable reasons behind it are a form that is too long and an account you made them create.
Contrast, to a standard
The one part of this with a published floor: 4.5:1 for ordinary text, 3:1 for large text, 3:1 for the button itself against what sits beside it. Testable in your browser in two minutes.
The thank-you page
The most wasted page on most websites. Somebody has just given you their details and is more interested in you than they will ever be again, and the page says “we will be in touch”.
A few of the fixes
Most of these are a text change rather than a build
Which is why they are worth doing first, and why the ninety-day plan at the back is ordered by cost rather than by impact.
By the numbers
What you are getting
Before you ask
Questions people send us about this one
What should I use instead of “Learn more” or “Submit”?
Something that describes where the click goes. Nielsen Norman Group’s advice is to “use keywords that describe the link’s destination”, and it calls the bare phrase “most dangerous when used alone because of its ambiguity and poor information scent”. So: “See how the audit works”, “Get my free quote”, “Send my enquiry”, “Book my 30 minutes”. The swipe file has sixty of them, sorted by page type.
How many calls to action should a page have?
Two. One primary action styled as the obvious thing to do, and one quieter action for the larger group who are not ready yet. That is our rule, not a research finding, and the document is explicit about the difference. You will find a percentage attached to this claim elsewhere; we could not source it, so we do not repeat it.
How much is a one point lift worth?
That depends entirely on your traffic, your close rate and what a customer is worth, which is why page 4 is a worksheet rather than a number. Six lines, figures you already have, about five minutes. If the answer is small, the constraint is upstream of your buttons and we would rather tell you that than sell you a redesign.
Is there research behind any of this, or is it opinion?
Both, and the document labels which on every page. Seven sources are quoted verbatim at the back: Baymard Institute on cart abandonment and on checkout form fields, two Nielsen Norman Group usability studies on “Learn more” and “Get started”, and the two WCAG contrast criteria. Everything that is our craft or our judgement says so.
Didn’t this page used to quote some statistics?
It did, and we removed them. Three figures that circulate with almost every article on this subject turned out to trace back only to blog posts citing each other: that 97 per cent of visitors are not ready to buy, that first-person button copy lifts click-through by 90 per cent, and a case study tripling leads in thirty days. We would rather publish a smaller, real number. Baymard’s 42 per cent for “just browsing, not ready to buy” makes the first point properly, and two usability studies make the second one better than a percentage ever did.