
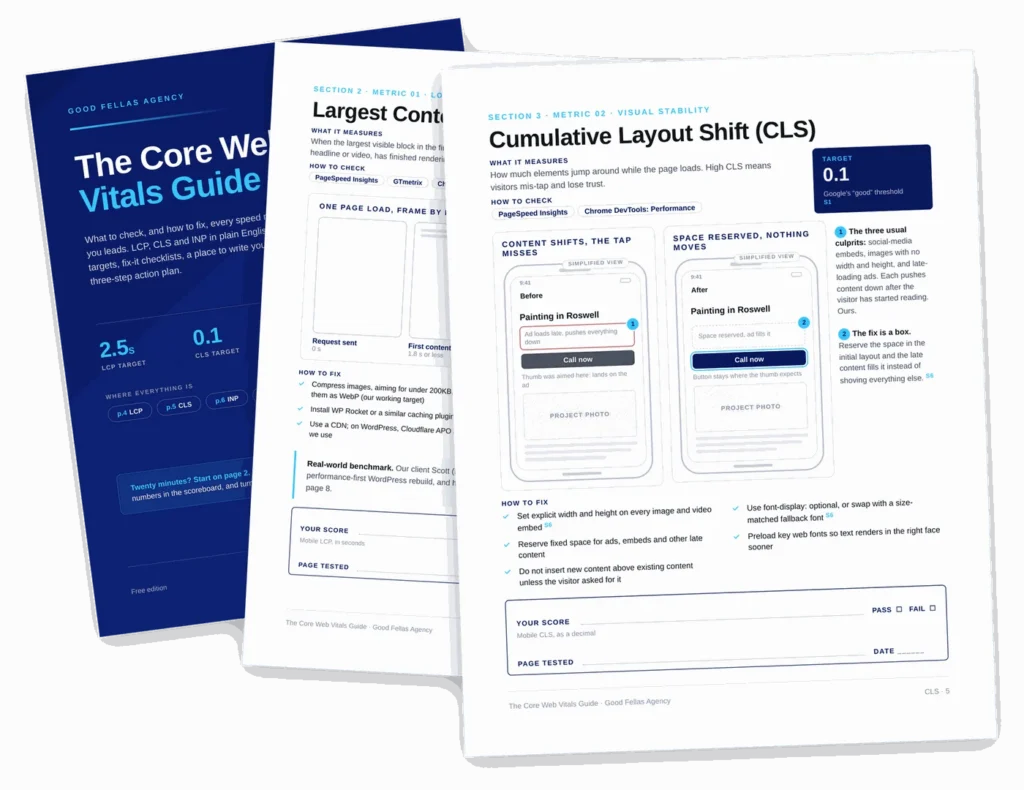
The document
Three metrics, three targets, and the fix for each one
Largest Contentful Paint, Cumulative Layout Shift and Interaction to Next Paint are the three measurements Google uses to describe real-world experience. The worksheet records yours, compares them to the targets, and names what to change.
It also covers the two server metrics that gate every other one, because a slow first byte makes the rest of the work invisible.
What is inside
Six sections, one per metric plus the plan
Each metric gets the same treatment: what it measures, what the target is, and what usually causes it to fail.
Largest Contentful Paint
How quickly the main content renders. Target under 2.5 seconds, and usually fixed by images and caching before anything else.
Cumulative Layout Shift
How much the page moves while it loads. Target under 0.1, and almost always caused by images or embeds without reserved space.
Interaction to Next Paint
How quickly the page responds to a tap. Target under 200 milliseconds, and the metric that replaced First Input Delay.
First byte and first paint
The server metrics underneath the other three. First Contentful Paint under 1.8 seconds, Time to First Byte under 800 milliseconds.
A worked rebuild
A performance-first rebuild that moved Largest Contentful Paint from 5.4 seconds to 1.1, with inbound enquiries inside two weeks.
The speed stack
A three-step plan and the specific tools, from image format and caching through to the CDN layer.
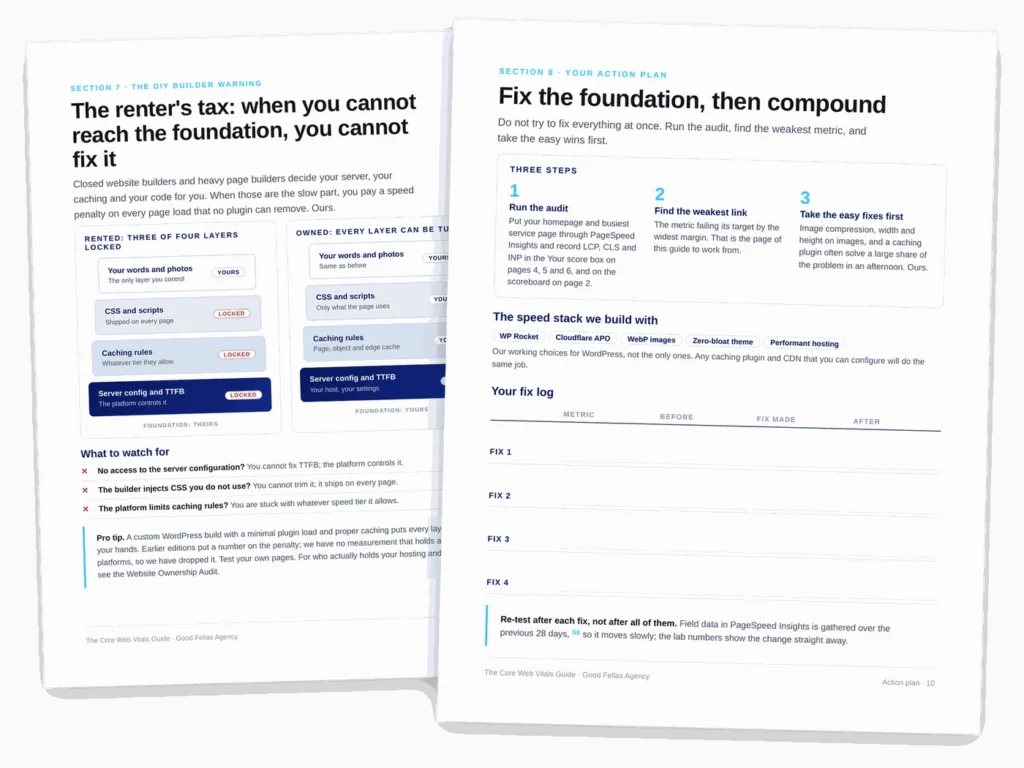
A few of the fixes
Six fixes, roughly in the order they pay off
Most sites recover the majority of their score in the first two.
The numbers behind it
What the research says
Before you ask
Questions people send us about this one
What are good Core Web Vitals scores?
Largest Contentful Paint under 2.5 seconds, Cumulative Layout Shift under 0.1, and Interaction to Next Paint under 200 milliseconds. The supporting server metrics are First Contentful Paint under 1.8 seconds and Time to First Byte under 800 milliseconds.
What happened to First Input Delay?
It was replaced by Interaction to Next Paint, which measures the full response to an interaction rather than just the delay before processing starts. The worksheet uses the current metric throughout.
Why is my page-builder site slow?
Builders add code you cannot fully optimise away, and the slowest sites are usually carrying several layers of it. Where you cannot reach server configuration, trim unused CSS or control caching rules, you are limited to what the platform allows.
What should I fix first?
Run PageSpeed Insights, record all three, and start with whichever is missing its target by the widest margin. In practice image compression, explicit dimensions and a caching layer resolve a large share of it in an afternoon.


